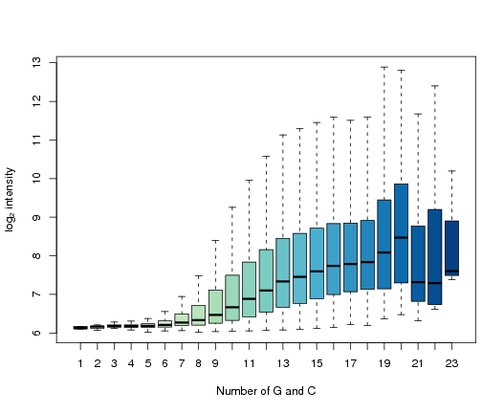
Figure 2.2:
Boxplots of the distributions of log_2-intensities from the CLL dataset grouped by GC-content. Please refer to the manual pages of the functions boxplot.stats and boxplot for details on the features shown in a boxplot.