# Lawlor human pancreas (SMARTer)
## Introduction
This performs an analysis of the @lawlor2017singlecell dataset,
consisting of human pancreas cells from various donors.
## Data loading
``` r
library(scRNAseq)
sce.lawlor <- LawlorPancreasData()
```
``` r
library(AnnotationHub)
edb <- AnnotationHub()[["AH73881"]]
anno <- select(edb, keys=rownames(sce.lawlor), keytype="GENEID",
columns=c("SYMBOL", "SEQNAME"))
rowData(sce.lawlor) <- anno[match(rownames(sce.lawlor), anno[,1]),-1]
```
## Quality control
``` r
unfiltered <- sce.lawlor
```
``` r
library(scater)
stats <- perCellQCMetrics(sce.lawlor,
subsets=list(Mito=which(rowData(sce.lawlor)$SEQNAME=="MT")))
qc <- quickPerCellQC(stats, percent_subsets="subsets_Mito_percent",
batch=sce.lawlor$`islet unos id`)
sce.lawlor <- sce.lawlor[,!qc$discard]
```
``` r
colData(unfiltered) <- cbind(colData(unfiltered), stats)
unfiltered$discard <- qc$discard
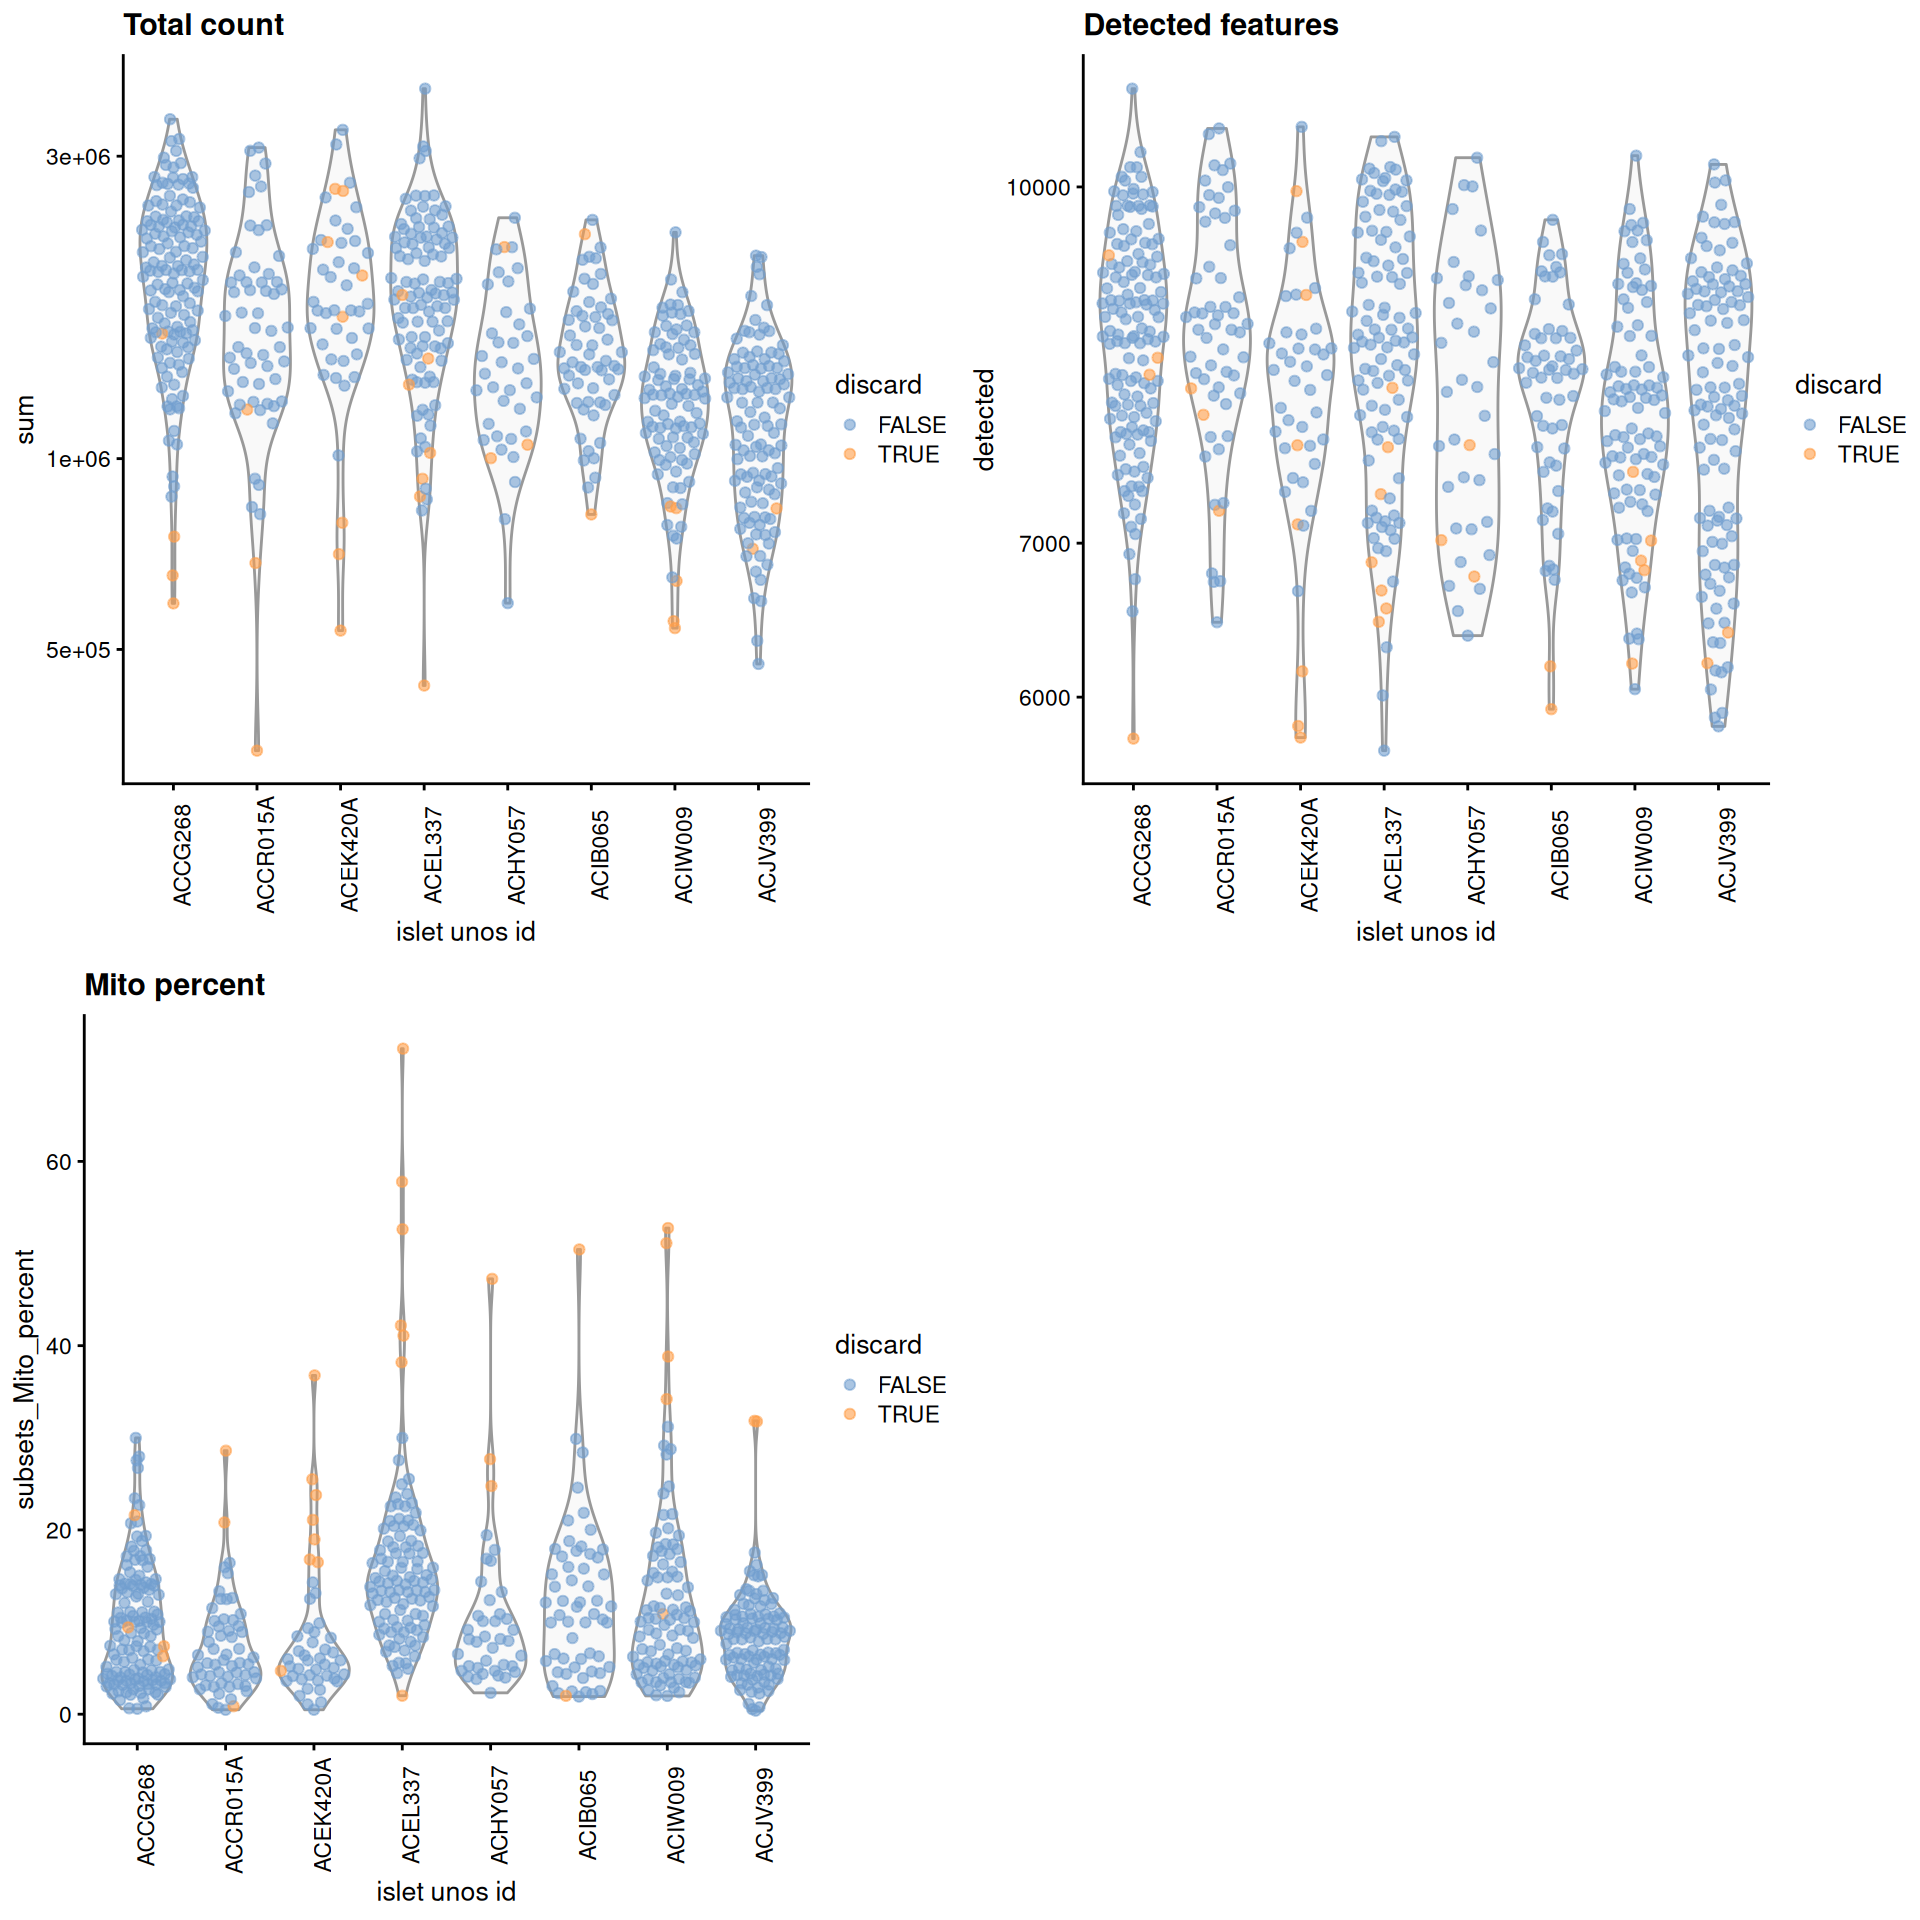
gridExtra::grid.arrange(
plotColData(unfiltered, x="islet unos id", y="sum", colour_by="discard") +
scale_y_log10() + ggtitle("Total count") +
theme(axis.text.x = element_text(angle = 90)),
plotColData(unfiltered, x="islet unos id", y="detected",
colour_by="discard") + scale_y_log10() + ggtitle("Detected features") +
theme(axis.text.x = element_text(angle = 90)),
plotColData(unfiltered, x="islet unos id", y="subsets_Mito_percent",
colour_by="discard") + ggtitle("Mito percent") +
theme(axis.text.x = element_text(angle = 90)),
ncol=2
)
```
(\#fig:unref-lawlor-qc-dist)Distribution of each QC metric across cells from each donor of the Lawlor pancreas dataset. Each point represents a cell and is colored according to whether that cell was discarded.
``` r
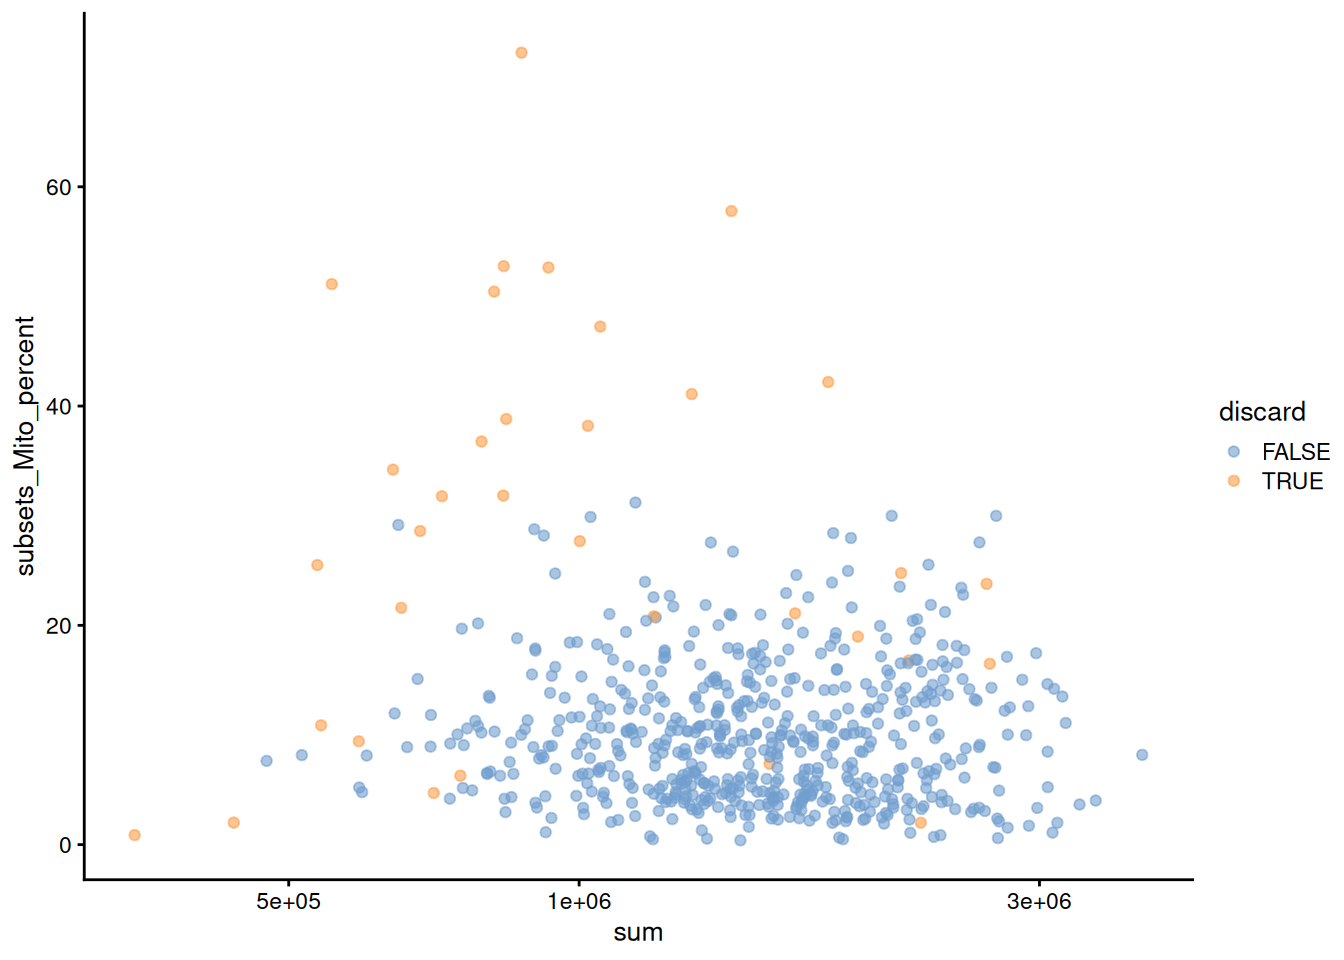
plotColData(unfiltered, x="sum", y="subsets_Mito_percent",
colour_by="discard") + scale_x_log10()
```
(\#fig:unref-lawlor-qc-comp)Percentage of mitochondrial reads in each cell in the 416B dataset compared to the total count. Each point represents a cell and is colored according to whether that cell was discarded.
``` r
colSums(as.matrix(qc))
```
```
## low_lib_size low_n_features high_subsets_Mito_percent
## 9 5 25
## discard
## 34
```
## Normalization
``` r
library(scran)
set.seed(1000)
clusters <- quickCluster(sce.lawlor)
sce.lawlor <- computeSumFactors(sce.lawlor, clusters=clusters)
sce.lawlor <- logNormCounts(sce.lawlor)
```
``` r
summary(sizeFactors(sce.lawlor))
```
```
## Min. 1st Qu. Median Mean 3rd Qu. Max.
## 0.295 0.781 0.963 1.000 1.182 2.629
```
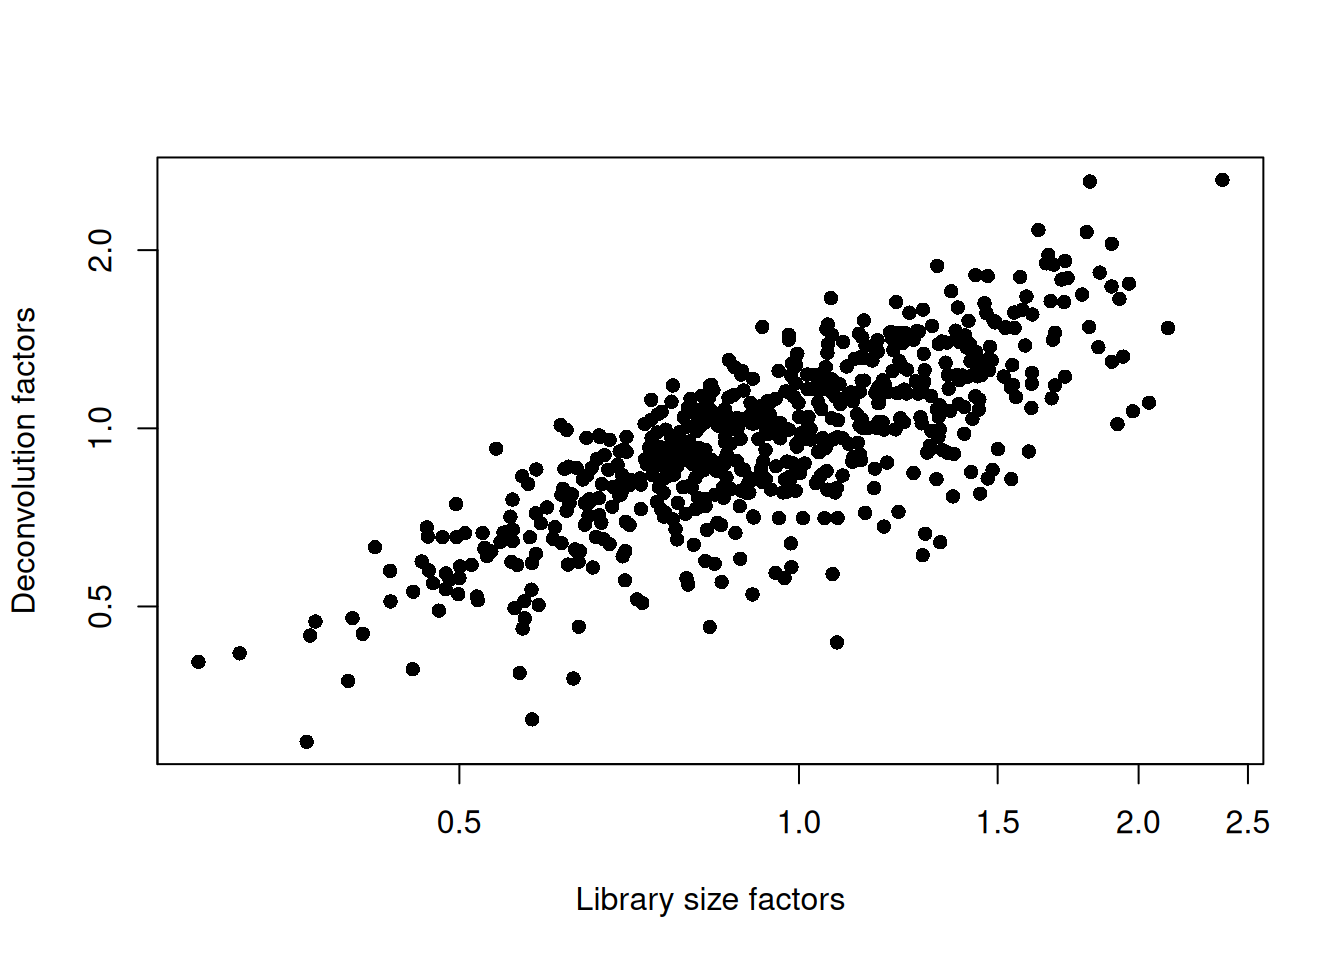
``` r
plot(librarySizeFactors(sce.lawlor), sizeFactors(sce.lawlor), pch=16,
xlab="Library size factors", ylab="Deconvolution factors", log="xy")
```
(\#fig:unref-lawlor-norm)Relationship between the library size factors and the deconvolution size factors in the Lawlor pancreas dataset.
## Variance modelling
Using age as a proxy for the donor.
``` r
dec.lawlor <- modelGeneVar(sce.lawlor, block=sce.lawlor$`islet unos id`)
chosen.genes <- getTopHVGs(dec.lawlor, n=2000)
```
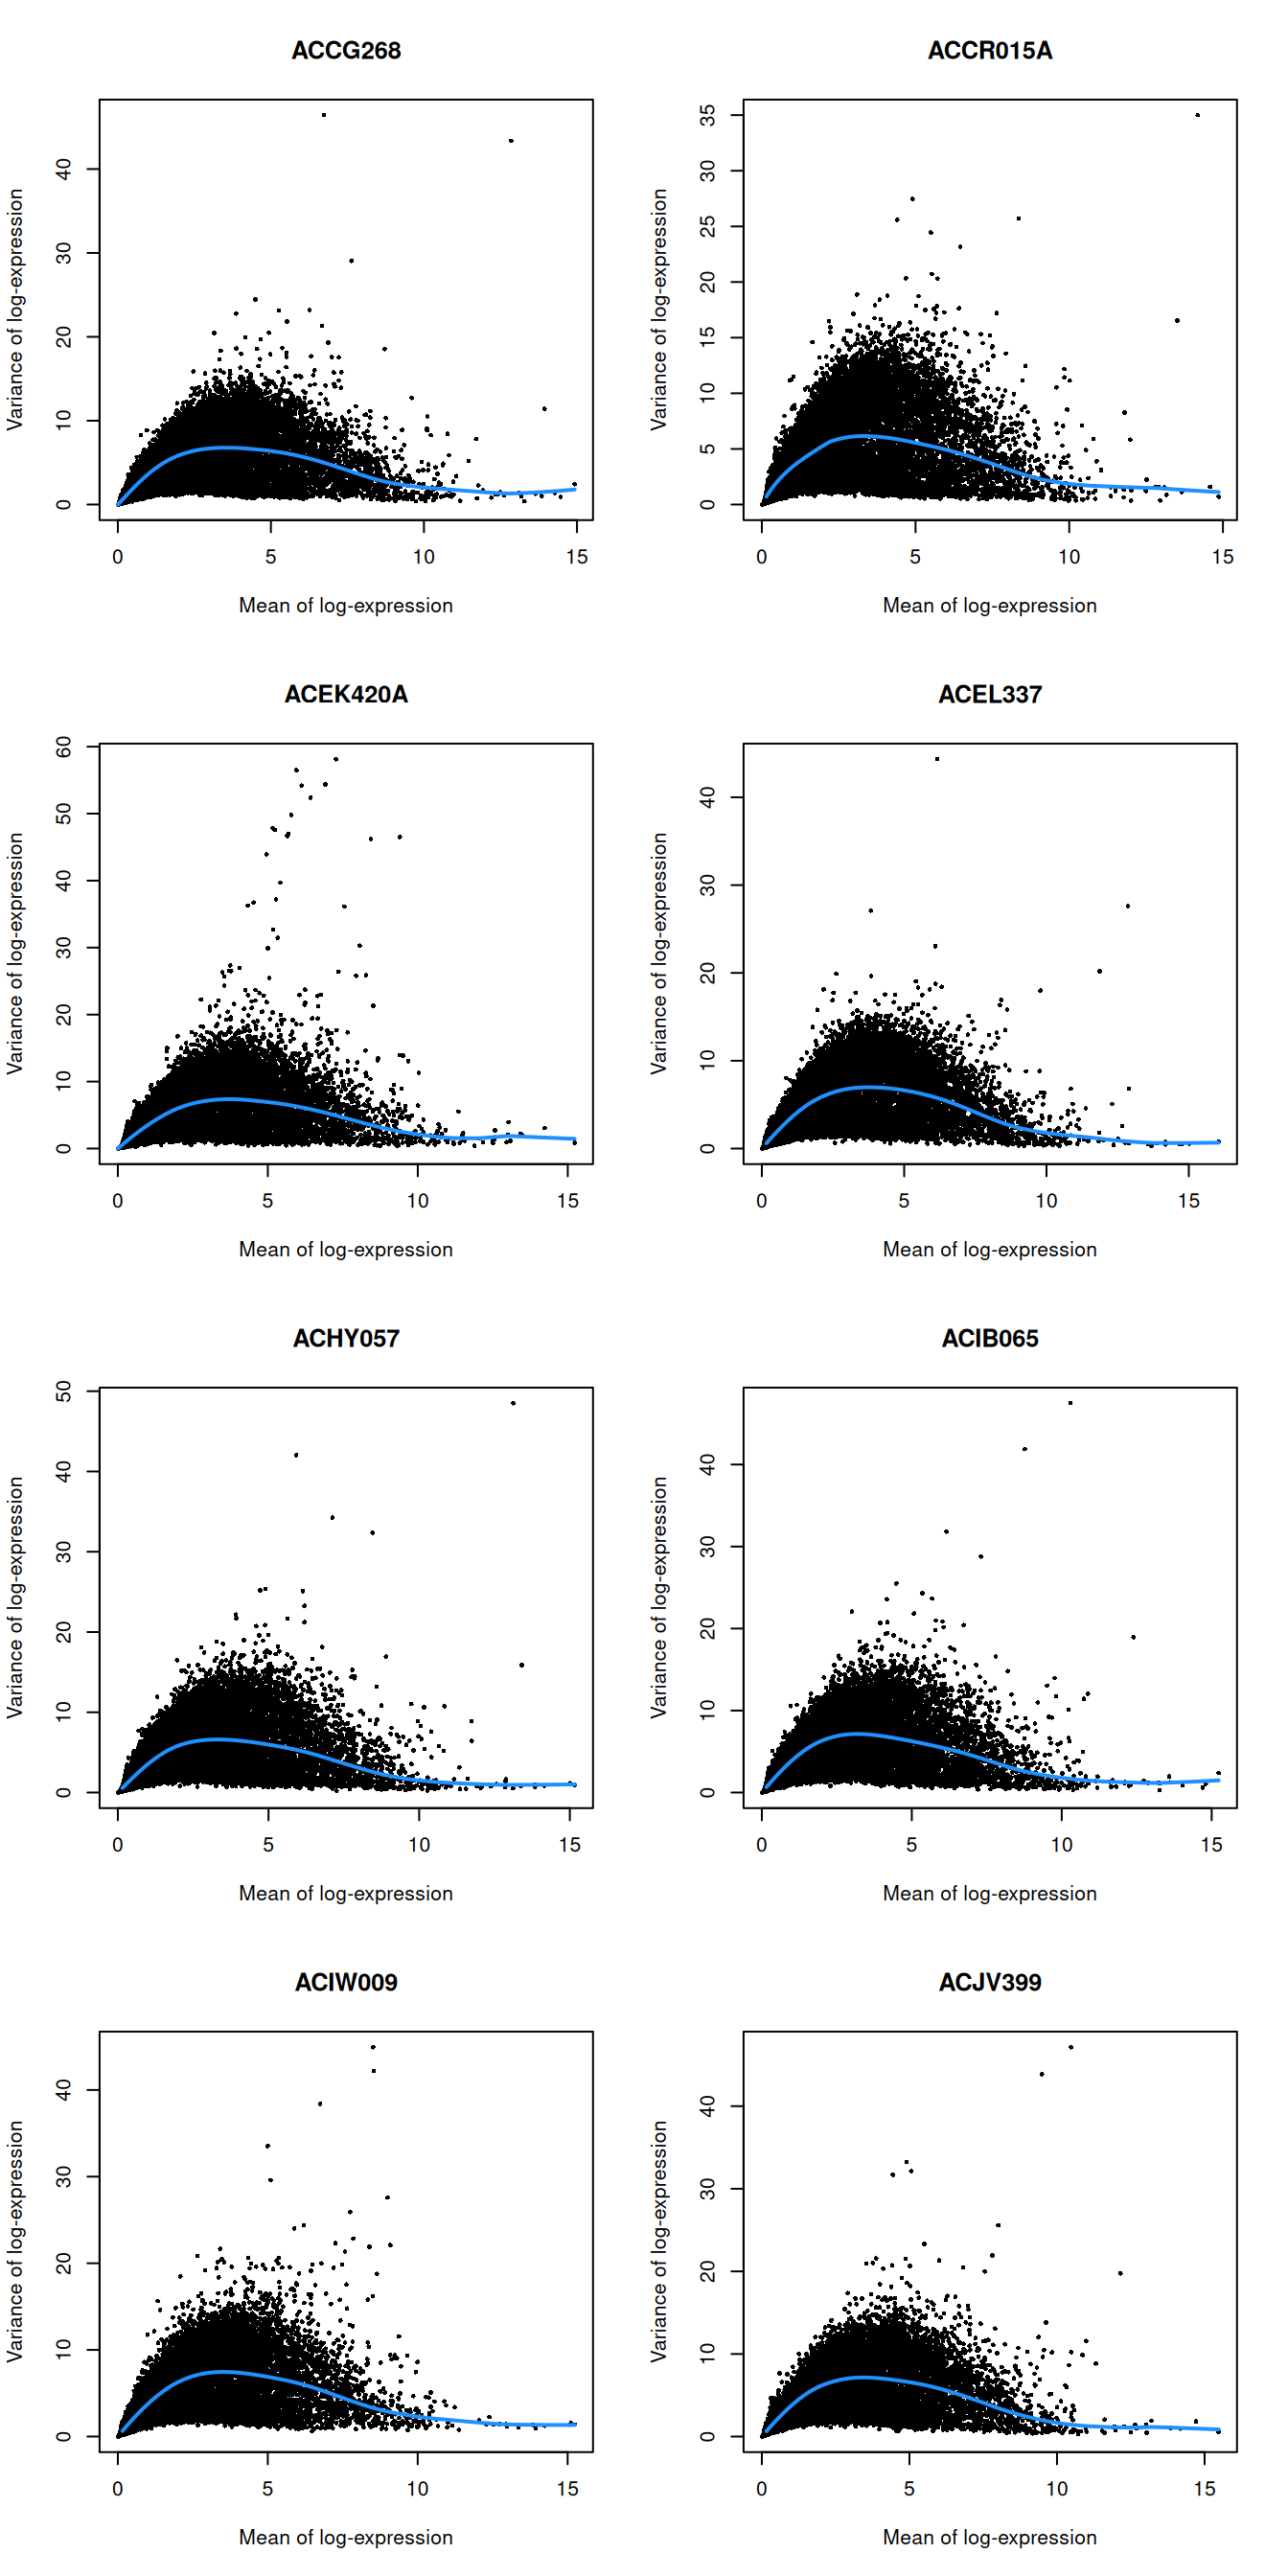
``` r
par(mfrow=c(4,2))
blocked.stats <- dec.lawlor$per.block
for (i in colnames(blocked.stats)) {
current <- blocked.stats[[i]]
plot(current$mean, current$total, main=i, pch=16, cex=0.5,
xlab="Mean of log-expression", ylab="Variance of log-expression")
curfit <- metadata(current)
curve(curfit$trend(x), col='dodgerblue', add=TRUE, lwd=2)
}
```
(\#fig:unnamed-chunk-4)Per-gene variance as a function of the mean for the log-expression values in the Lawlor pancreas dataset. Each point represents a gene (black) with the mean-variance trend (blue) fitted separately for each donor.
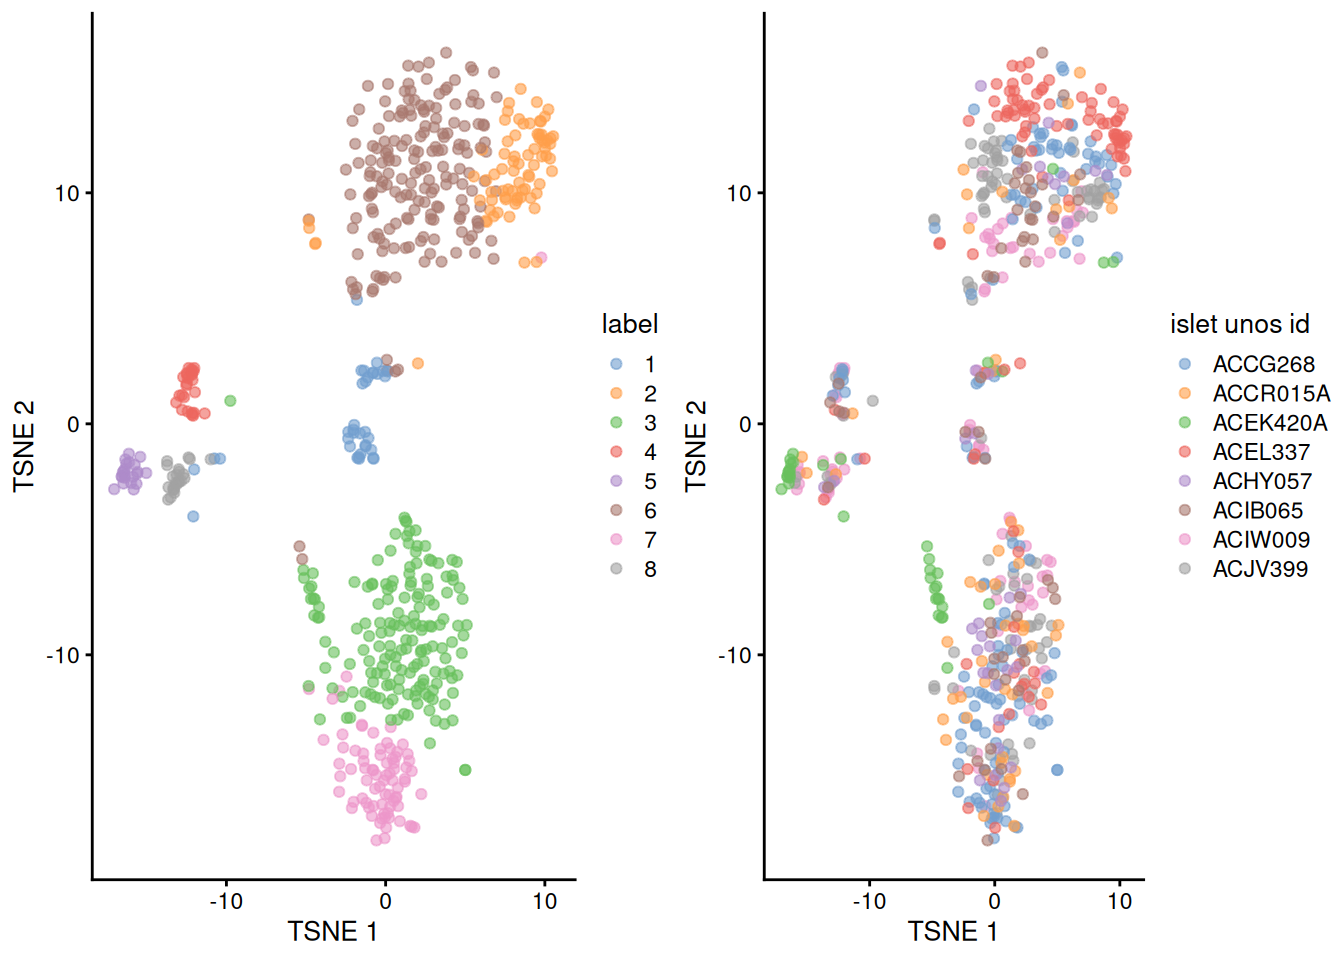
(\#fig:unref-grun-tsne)Obligatory $t$-SNE plots of the Lawlor pancreas dataset. Each point represents a cell that is colored by cluster (left) or batch (right).