# Muraro human pancreas (CEL-seq)
## Introduction
This performs an analysis of the @muraro2016singlecell CEL-seq dataset,
consisting of human pancreas cells from various donors.
## Data loading
``` r
library(scRNAseq)
sce.muraro <- MuraroPancreasData()
```
Converting back to Ensembl identifiers.
``` r
library(AnnotationHub)
edb <- AnnotationHub()[["AH73881"]]
gene.symb <- sub("__chr.*$", "", rownames(sce.muraro))
gene.ids <- mapIds(edb, keys=gene.symb,
keytype="SYMBOL", column="GENEID")
# Removing duplicated genes or genes without Ensembl IDs.
keep <- !is.na(gene.ids) & !duplicated(gene.ids)
sce.muraro <- sce.muraro[keep,]
rownames(sce.muraro) <- gene.ids[keep]
```
## Quality control
``` r
unfiltered <- sce.muraro
```
This dataset lacks mitochondrial genes so we will do without.
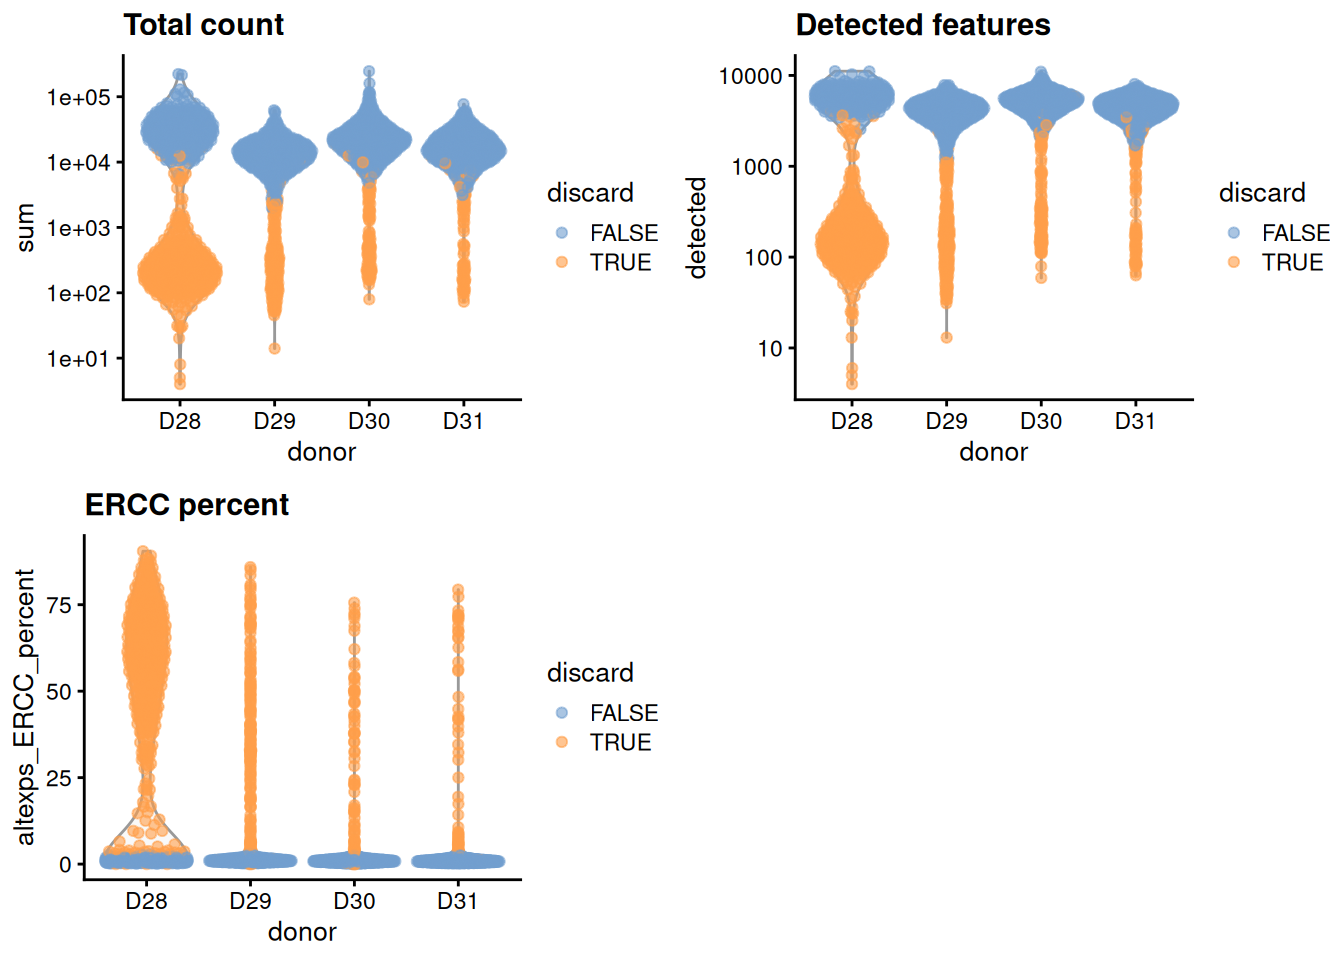
For the one batch that seems to have a high proportion of low-quality cells, we compute an appropriate filter threshold using a shared median and MAD from the other batches (Figure \@ref(fig:unref-muraro-qc-dist)).
``` r
library(scater)
stats <- perCellQCMetrics(sce.muraro)
qc <- quickPerCellQC(stats, percent_subsets="altexps_ERCC_percent",
batch=sce.muraro$donor, subset=sce.muraro$donor!="D28")
sce.muraro <- sce.muraro[,!qc$discard]
```
``` r
colData(unfiltered) <- cbind(colData(unfiltered), stats)
unfiltered$discard <- qc$discard
gridExtra::grid.arrange(
plotColData(unfiltered, x="donor", y="sum", colour_by="discard") +
scale_y_log10() + ggtitle("Total count"),
plotColData(unfiltered, x="donor", y="detected", colour_by="discard") +
scale_y_log10() + ggtitle("Detected features"),
plotColData(unfiltered, x="donor", y="altexps_ERCC_percent",
colour_by="discard") + ggtitle("ERCC percent"),
ncol=2
)
```
(\#fig:unref-muraro-qc-dist)Distribution of each QC metric across cells from each donor in the Muraro pancreas dataset. Each point represents a cell and is colored according to whether that cell was discarded.
We have a look at the causes of removal:
``` r
colSums(as.matrix(qc))
```
```
## low_lib_size low_n_features high_altexps_ERCC_percent
## 663 700 738
## discard
## 773
```
## Normalization
``` r
library(scran)
set.seed(1000)
clusters <- quickCluster(sce.muraro)
sce.muraro <- computeSumFactors(sce.muraro, clusters=clusters)
sce.muraro <- logNormCounts(sce.muraro)
```
``` r
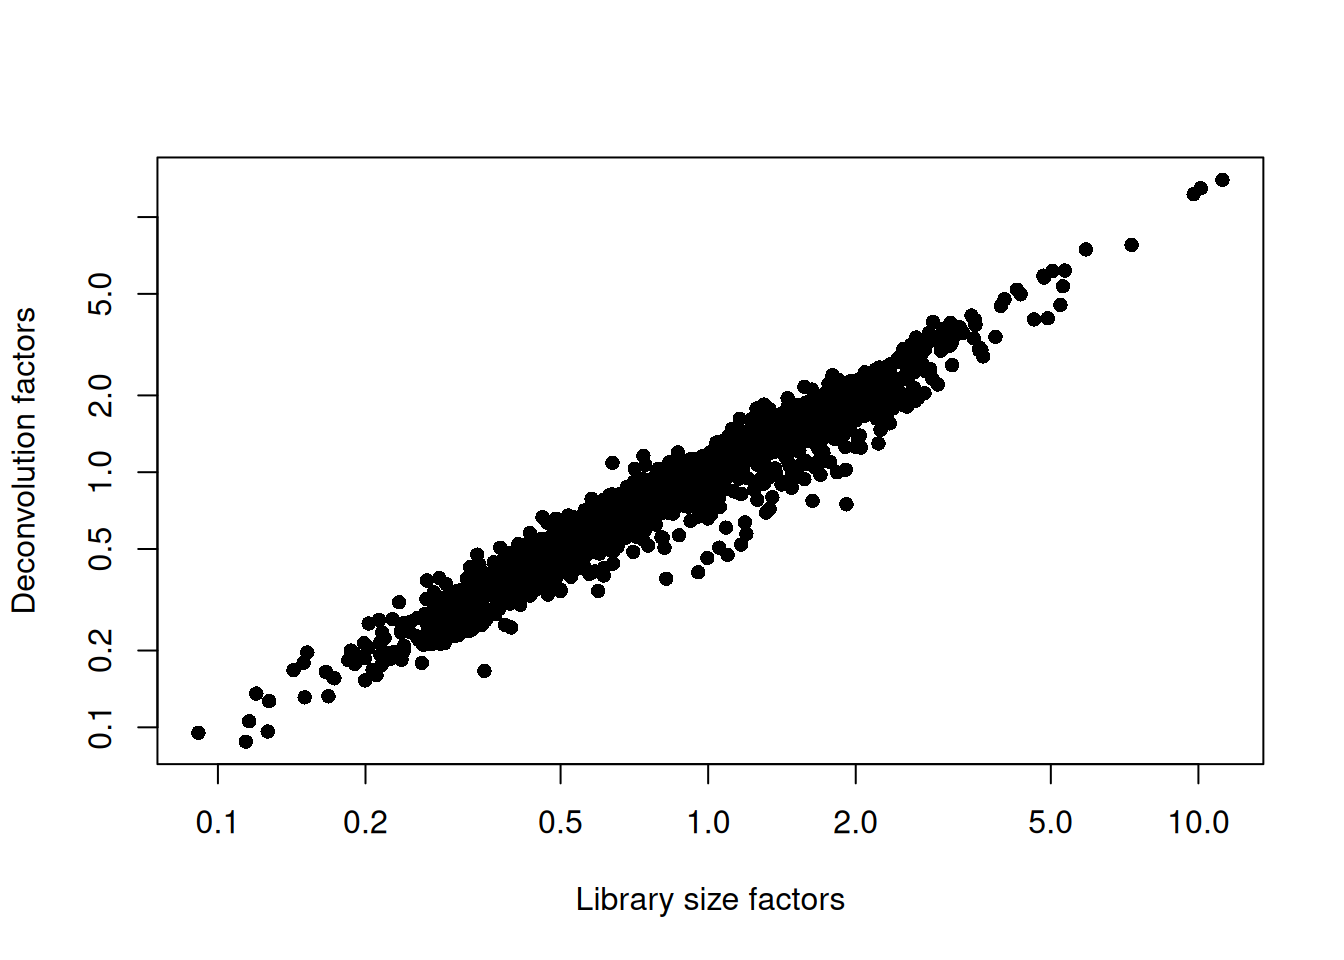
summary(sizeFactors(sce.muraro))
```
```
## Min. 1st Qu. Median Mean 3rd Qu. Max.
## 0.0878 0.5411 0.8208 1.0000 1.2108 13.9869
```
``` r
plot(librarySizeFactors(sce.muraro), sizeFactors(sce.muraro), pch=16,
xlab="Library size factors", ylab="Deconvolution factors", log="xy")
```
(\#fig:unref-muraro-norm)Relationship between the library size factors and the deconvolution size factors in the Muraro pancreas dataset.
## Variance modelling
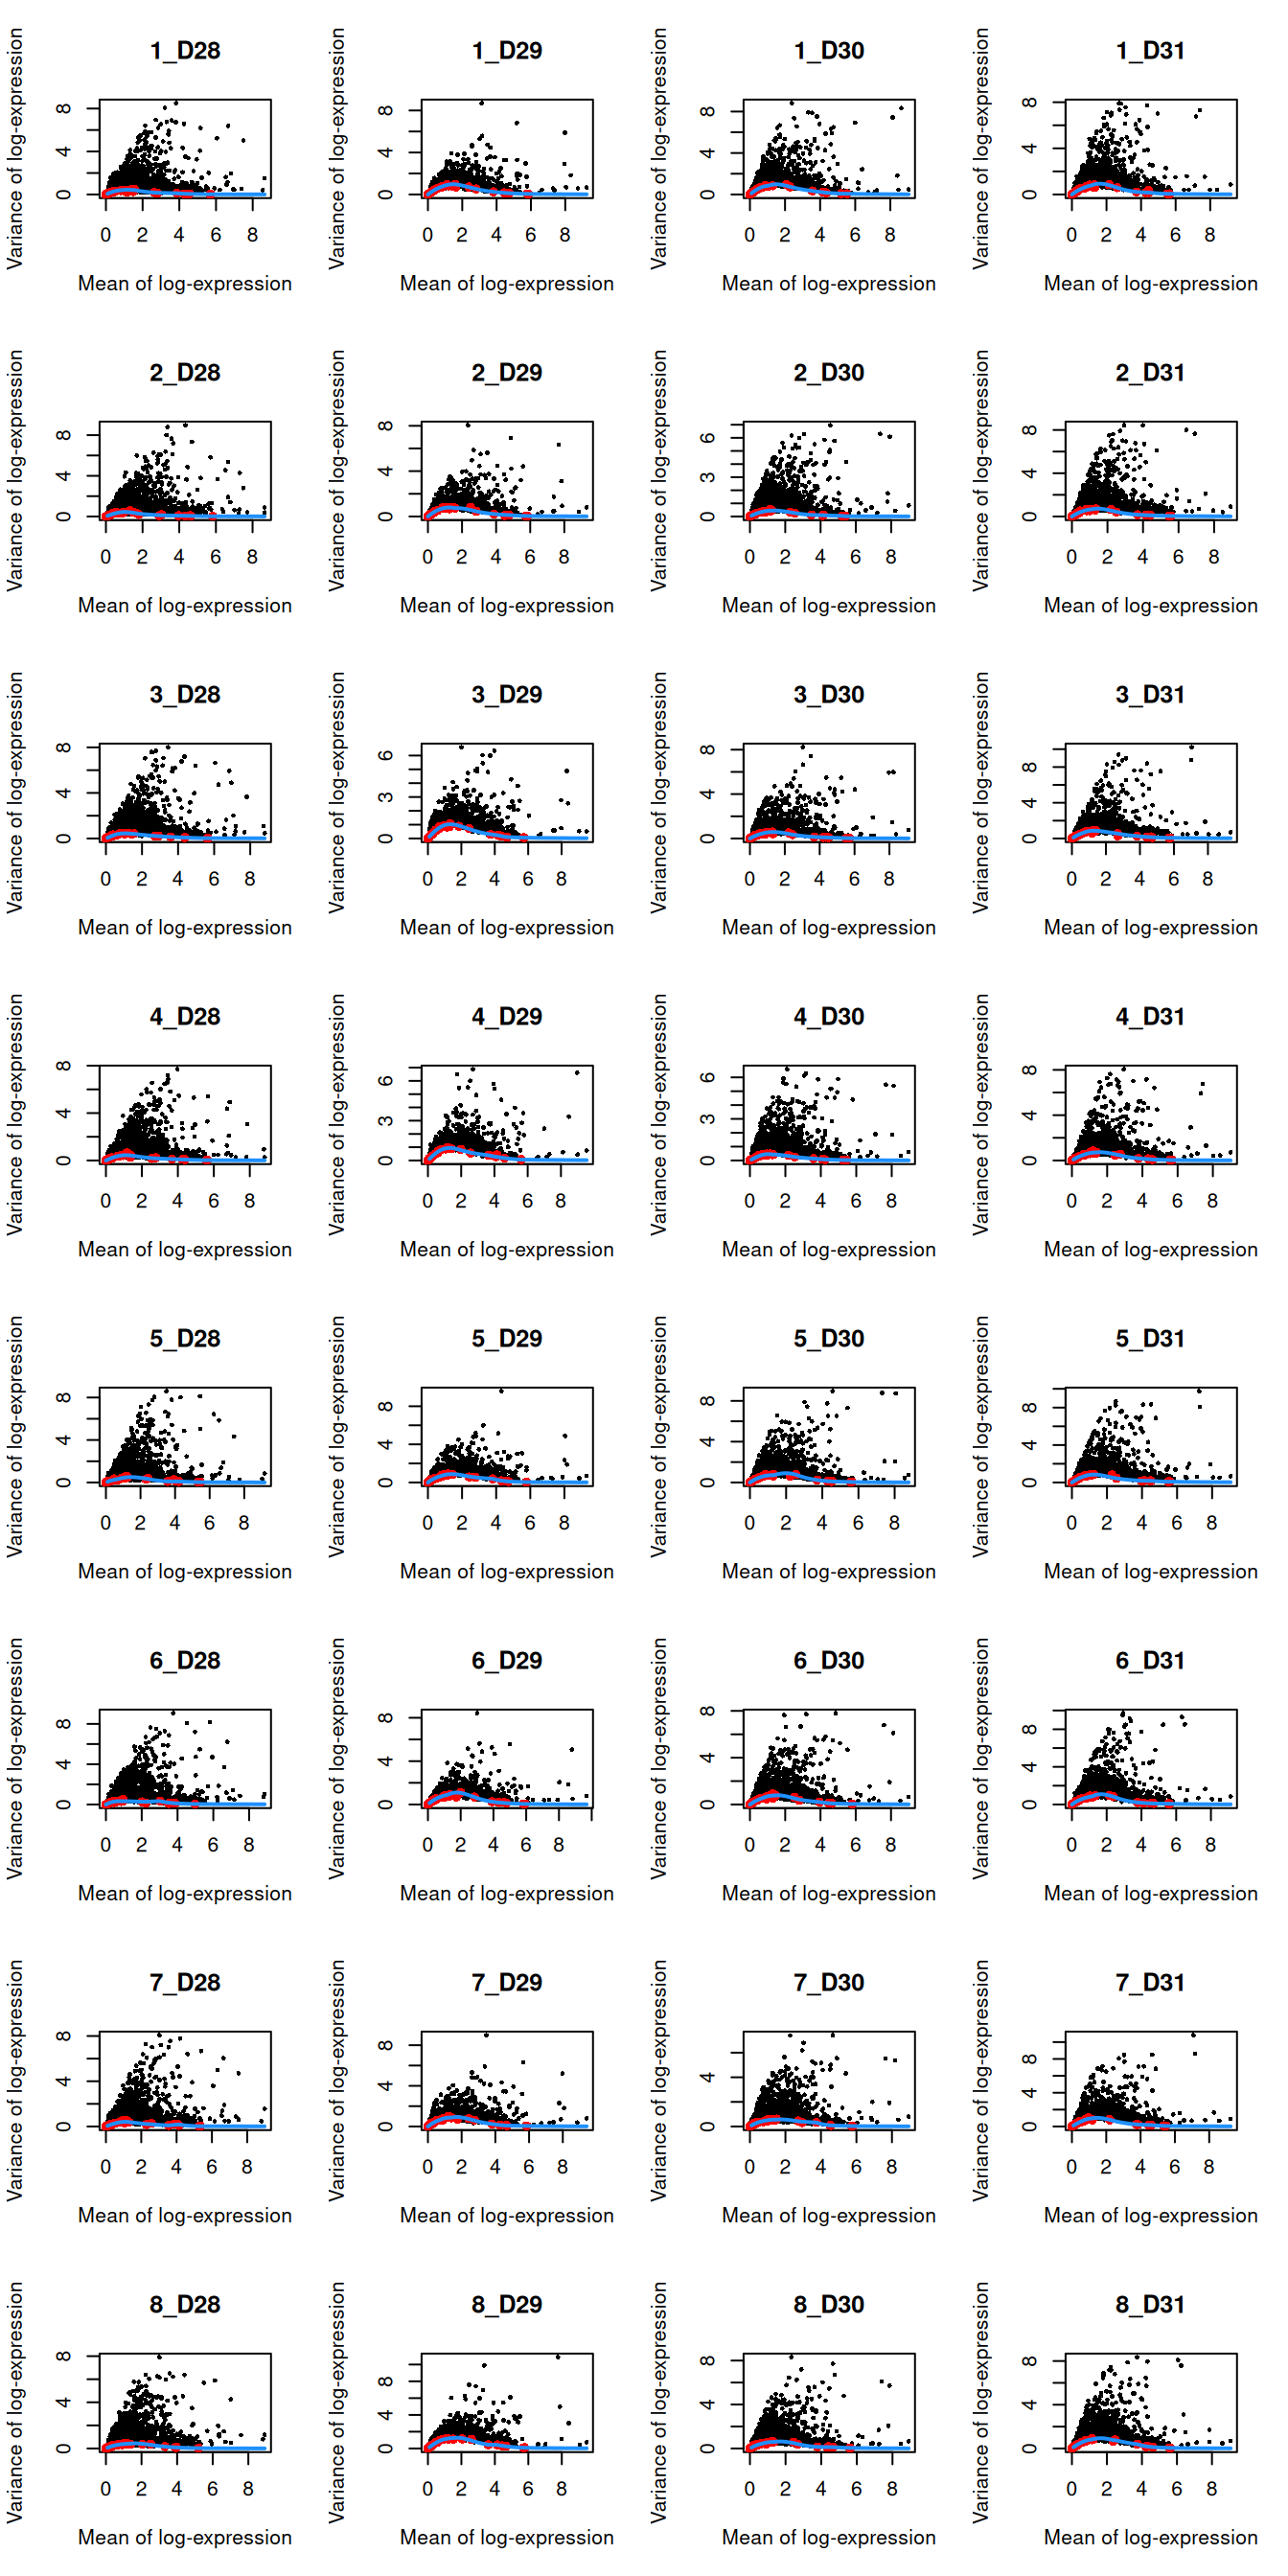
We block on a combined plate and donor factor.
``` r
block <- paste0(sce.muraro$plate, "_", sce.muraro$donor)
dec.muraro <- modelGeneVarWithSpikes(sce.muraro, "ERCC", block=block)
top.muraro <- getTopHVGs(dec.muraro, prop=0.1)
```
``` r
par(mfrow=c(8,4))
blocked.stats <- dec.muraro$per.block
for (i in colnames(blocked.stats)) {
current <- blocked.stats[[i]]
plot(current$mean, current$total, main=i, pch=16, cex=0.5,
xlab="Mean of log-expression", ylab="Variance of log-expression")
curfit <- metadata(current)
points(curfit$mean, curfit$var, col="red", pch=16)
curve(curfit$trend(x), col='dodgerblue', add=TRUE, lwd=2)
}
```
(\#fig:unref-muraro-variance)Per-gene variance as a function of the mean for the log-expression values in the Muraro pancreas dataset. Each point represents a gene (black) with the mean-variance trend (blue) fitted to the spike-in transcripts (red) separately for each donor.
## Data integration
``` r
library(batchelor)
set.seed(1001010)
merged.muraro <- fastMNN(sce.muraro, subset.row=top.muraro,
batch=sce.muraro$donor)
```
We use the proportion of variance lost as a diagnostic measure:
``` r
metadata(merged.muraro)$merge.info$lost.var
```
```
## D28 D29 D30 D31
## [1,] 0.060847 0.024121 0.000000 0.00000
## [2,] 0.002646 0.003018 0.062421 0.00000
## [3,] 0.003449 0.002641 0.002598 0.08162
```
## Dimensionality reduction
``` r
set.seed(100111)
merged.muraro <- runTSNE(merged.muraro, dimred="corrected")
```
## Clustering
``` r
snn.gr <- buildSNNGraph(merged.muraro, use.dimred="corrected")
colLabels(merged.muraro) <- factor(igraph::cluster_walktrap(snn.gr)$membership)
```
``` r
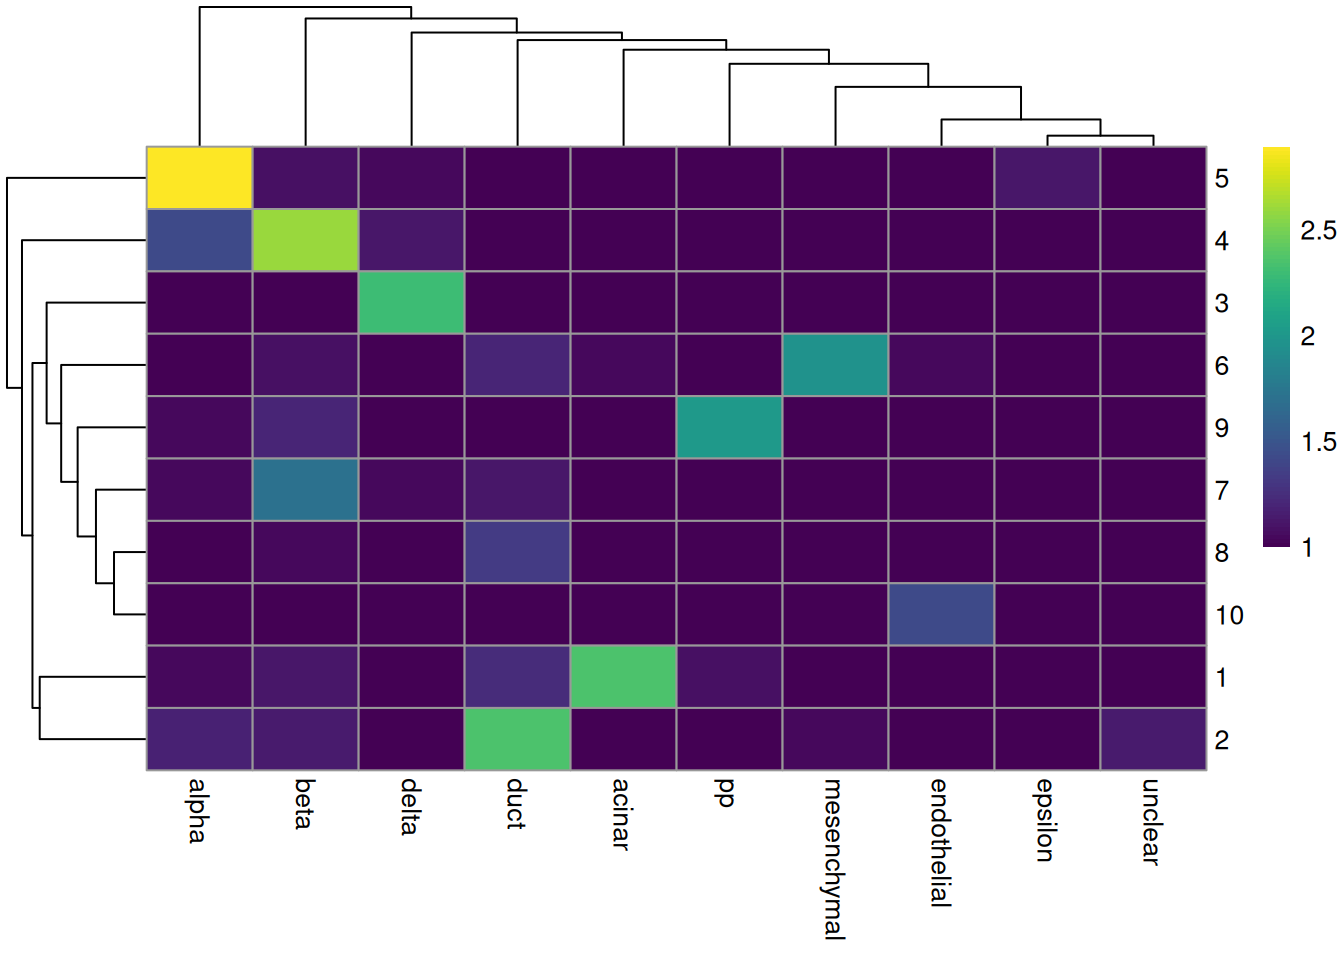
tab <- table(Cluster=colLabels(merged.muraro), CellType=sce.muraro$label)
library(pheatmap)
pheatmap(log10(tab+10), color=viridis::viridis(100))
```
(\#fig:unref-seger-heat)Heatmap of the frequency of cells from each cell type label in each cluster.
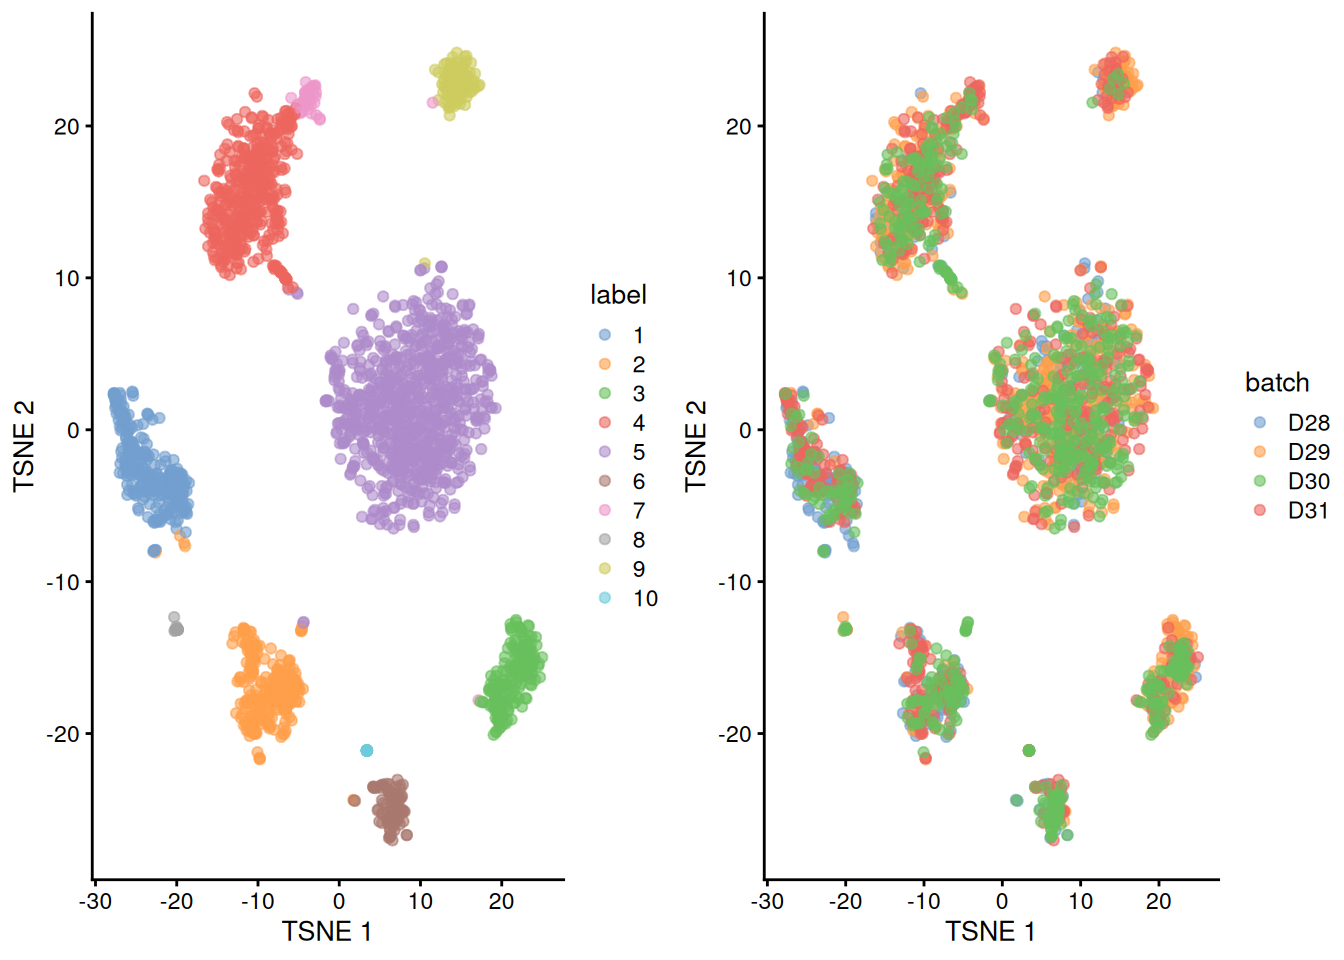
(\#fig:unref-muraro-tsne)Obligatory $t$-SNE plots of the Muraro pancreas dataset. Each point represents a cell that is colored by cluster (left) or batch (right).