

![]()
![]()
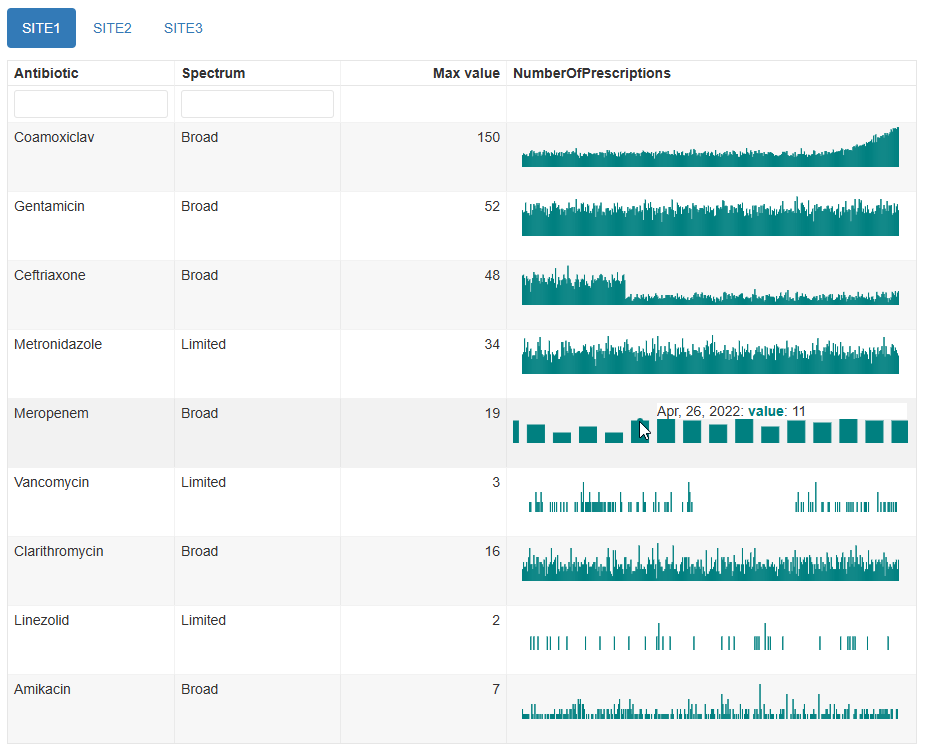
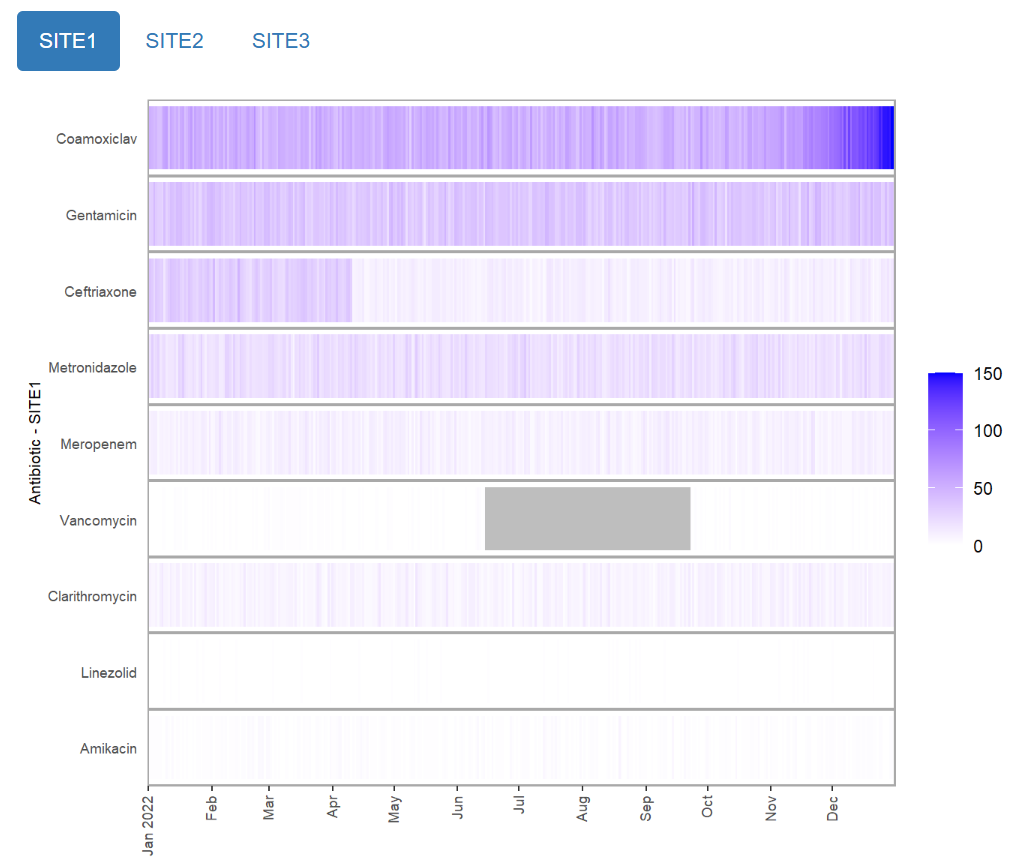
The mantis package generates interactive reports that
enable quick visual review of multiple related time series stored in a
data frame. This can help with identification of temporal artefacts and
unexpected trends. The choice of visualisations include interactive
plots with adjustable axes and tooltips showing the individual dates and
values, as well as static heatmap and scatter plots for more lightweight
applications. E.g.
The resulting html reports are self-contained and shareable without a web server.
Example reports and more detailed guidance can be found in the package
website, including how to add alerting
rules and how to add mantis visualisations to your own
bespoke
reports.
We anticipate two main target users:
Researchers who analyse data from large, temporal datasets, particularly routinely-collected data such as electronic health records. Included as part of the initial analysis stage, it will help you to check for any temporal biases in your datasets before embarking on your main analyses, therefore improving the reliability of your study.
Managers of live data feeds that are used as a data source for downstream analyses. Regular inspection of data that is frequently updated will help to identify any issues early and enable a timely response to rectify issues such as missing data. While a set of validation checks in a data pipeline could also work in this circumstance, the benefit of this package is the ability to check for temporal anomalies that are obvious to the human eye but that are difficult to capture programmatically.
# install from CRAN
install.packages("mantis")

# or install the current development version
# install stable dependencies first
install.packages(c(
  "remotes",
  "rmarkdown",
  "knitr",
  "reactable",
  "dplyr",
  "tidyr",
  "dygraphs",
  "xts",
  "ggplot2",
  "scales",
  "purrr",
  "htmltools"
))
remotes::install_github("phuongquan/mantis", dependencies = FALSE)library(mantis)
# this example data frame contains numbers of antibiotic prescriptions
# in long format
data("example_prescription_numbers")
head(example_prescription_numbers)## # A tibble: 6 × 5
## PrescriptionDate Antibiotic Spectrum NumberOfPrescriptions Location
## <date> <chr> <chr> <dbl> <chr>
## 1 2022-01-01 Coamoxiclav Broad 45 SITE1
## 2 2022-01-01 Gentamicin Broad 34 SITE1
## 3 2022-01-01 Ceftriaxone Broad 36 SITE1
## 4 2022-01-01 Metronidazole Limited 17 SITE1
## 5 2022-01-01 Meropenem Broad 10 SITE1
## 6 2022-01-01 Vancomycin Limited 0 SITE1# create a report in the working directory, with one tab per Location
mantis_report(
df = example_prescription_numbers,
file = "example_prescription_numbers_report.html",
inputspec = inputspec(
timepoint_col = "PrescriptionDate",
item_cols = c("Location", "Antibiotic", "Spectrum"),
value_col = "NumberOfPrescriptions",
tab_col = "Location",
timepoint_unit = "day"
)
)mantis is designed for use on data that is essentially a
collection of time series in a data frame, where you have already
decided which values you are interested in reviewing. If you want to
check more generally for temporal changes in record-level, non-numeric
data, then check out our sister package daiquiri.
If you are not specifically interested in temporal changes, you could
try visually inspecting your data frames with visdat, or run
validation checks on them with assertr
or pointblank.
This work was supported by the National Institute for Health Research Health Protection Research Unit (NIHR HPRU) in Healthcare Associated Infections and Antimicrobial Resistance at the University of Oxford in partnership with the UK Health Security Agency (UKHSA) (NIHR200915), and by the NIHR Oxford Biomedical Research Centre.
Please report any bugs or suggestions by opening a github issue.