![]()
![]()
The goal of ecoteach is to provide a collection of curated educational datasets for teaching ecology and agriculture concepts. The package includes data on wildlife monitoring, plant treatments, and ecological observations with documentation and examples for educational use.
The package includes the following datasets:
#> - `badger_energy`
#>  - `barnswallow_brightness`
#>  - `berberis_treatment`
#>  - `carrion_arrivals`
#>  - `chimpanzee_cameras`
#>  - `dormouse_hibernation`
#>  - `Dsimulans_matechoice`
#>  - `elephant_farmers`
#>  - `lion_reproduction`
#>  - `magellanic_penguins`
#>  - `pangolin_habitat`
#>  - `raccoondog_environment`
#>  - `scavenger_community`
#>  - `vulture_diet`
#>  - `whale_brains`
Each dataset includes comprehensive documentation with details about the variables, source references, and suggested analyses for teaching purposes.
You can install the development version from GitHub with:
# install.packages("devtools")
devtools::install_github("username/ecoteach")This package provides datasets that can be used to teach ecological and statistical concepts. Here’s an example using the dormouse hibernation dataset:
# Load the package
library(ecoteach)
# Or use devtools::load_all() during development
# devtools::load_all()

# Load the badger energy dataset
data(badger_energy)

# View the data structure
str(badger_energy)
#> Classes 'tbl_df', 'tbl' and 'data.frame':    55 obs. of  8 variables:
#>  $ ID          : Factor w/ 44 levels "12F","13F","14P",..: 1 2 3 4 4 5 6 7 7 8 ...
#>  $ age         : Factor w/ 2 levels "cub","adult": 1 1 2 2 2 2 2 2 1 2 ...
#>  $ sex         : Factor w/ 2 levels "F","M": 1 1 2 2 2 1 2 2 2 2 ...
#>  $ group_size  : num  14 14 5 7 7 14 13 13 14 6 ...
#>  $ body_mass   : num  3.2 3.3 8.9 8.9 8.7 6.4 8.9 9.9 3.7 8.5 ...
#>  $ daily_energy: num  1389 2534 3156 2812 3040 ...
#>  $ season      : Factor w/ 4 levels "Winter","Spring",..: 3 3 1 1 3 3 4 1 3 1 ...
#>  $ disease     : Factor w/ 3 levels "Negative","Diseased",..: 1 1 1 1 1 1 2 1 1 1 ...

# Graph daily energy as a function of season
badger_energy$season <- droplevels(badger_energy$season)
boxplot(daily_energy~season, data = badger_energy)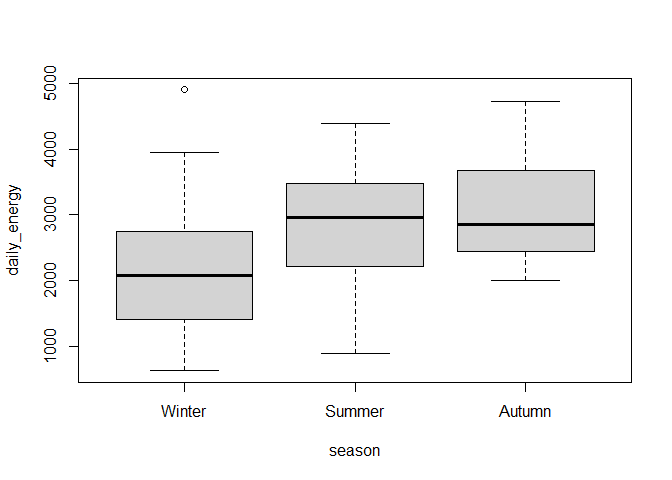
The dormouse hibernation dataset contains data on hibernation patterns and body mass changes in edible dormice (Glis glis). We can create a simple visualization to explore how body mass changes during hibernation:
# Load the data
data(dormouse_hibernation)

# Basic analysis of body mass loss during hibernation

library(ggplot2)

# Calculate percentage of body mass lost
dormouse_hibernation$mass_loss_percent <-
  (dormouse_hibernation$body_mass_before - dormouse_hibernation$body_mass_after) /
  dormouse_hibernation$body_mass_before * 100

# Create a boxplot of mass loss percentage by sex
ggplot(dormouse_hibernation, aes(x = sex, y = mass_loss_percent, fill = sex)) +
  geom_boxplot() +
  labs(title = "Body Mass Loss During Hibernation in Dormice",
       x = "Sex",
       y = "Body Mass Loss (%)") +
  theme_minimal()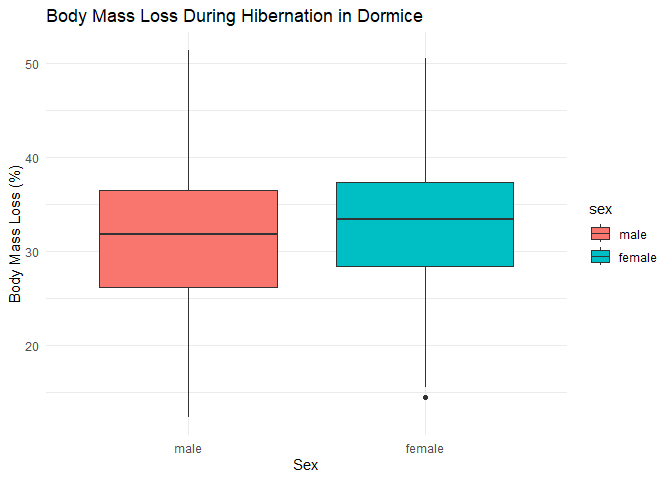
This example shows how the dataset can be used to explore sex differences in hibernation physiology, which could be used in a teaching context to demonstrate boxplots, t-tests, or ANOVA.