
![]()
![]()
![]()
This package contains functions useful for analyzing network data for diffusion of innovations applications.
The package was developed as part of the paper Thomas W. Valente, Stephanie R. Dyal, Kar-Hai Chu, Heather Wipfli, Kayo Fujimoto, Diffusion of innovations theory applied to global tobacco control treaty ratification, Social Science & Medicine, Volume 145, November 2015, Pages 89-97, ISSN 0277-9536 (available here).
From the description:
Empirical statistical analysis, visualization and simulation of diffusion and contagion processes on networks. The package implements algorithms for calculating network diffusion statistics such as transmission rate, hazard rates, exposure models, network threshold levels, infectiousness (contagion), and susceptibility. The package is inspired by work published in Valente, et al., (2015); Valente (1995), Myers (2000), Iyengar and others (2011), Burt (1987); among others.
Acknowledgements: netdiffuseR was created with the support of grant R01 CA157577 from the National Cancer Institute/National Institutes of Health.
citation(package="netdiffuseR")
To cite netdiffuseR in publications use the following paper:

  Valente TW, Vega Yon GG. Diffusion/Contagion Processes on Social
  Networks. Health Education & Behavior. 2020;47(2):235-248.
  doi:10.1177/1090198120901497

And the actual R package:

  Vega Yon G, Olivera Morales A, Valente T (2025). _netdiffuseR:
  Analysis of Diffusion and Contagion Processes on Networks_.
  doi:10.5281/zenodo.1039317 <https://doi.org/10.5281/zenodo.1039317>,
  R package version 1.25.0, <https://github.com/USCCANA/netdiffuseR>.

To see these entries in BibTeX format, use 'print(<citation>,
bibtex=TRUE)', 'toBibtex(.)', or set
'options(citation.bibtex.max=999)'.Changelog can be view here.
To get the CRAN (stable) version of the package, simple type
install.packages("netdiffuseR")If you want the latest (unstable) version of
netdiffuseR, using the remotes package,
you can install netdiffuseR dev version as follows
remotes::install_github('USCCANA/netdiffuseR', build_vignettes = TRUE)You can skip building vignettes by setting
build_vignettes = FALSE (so it is not required). You can
also get the package (pre-built binaries) from our R-Universe repository
(recommended):
install.packages(
  'epiworldR',
  repos = c(
    'https://uofuepibio.r-universe.dev',
    'https://cloud.r-project.org'
  )
)Since starting netdiffuseR, we have done a couple of workshops at Sunbelt and NASN. Past and current workshops can be found at https://github.com/USCCANA/netdiffuser-workshop
This example has been taken from the package’s vignettes:
library(netdiffuseR)
#> Thank you for using netdiffuseR! Please consider citing it in your work.
#> You can find the citation information by running
#>   citation("netdiffuseR")
#>
#> Attaching package: 'netdiffuseR'
#> The following object is masked from 'package:base':
#>
#> %*%# Generating a random graph
set.seed(1234)
n <- 100
nper <- 20
graph <- rgraph_er(n, nper, .5)
toa <- sample(c(1:(1+nper-1), NA), n, TRUE)
head(toa)
#> [1] 16 3 14 3 13 5
# Creating a diffnet object
diffnet <- as_diffnet(graph, toa)
diffnet
#> Dynamic network of class -diffnet-
#> Name : Diffusion Network
#> Behavior : Unknown
#> # of nodes : 100 (1, 2, 3, 4, 5, 6, 7, 8, ...)
#> # of time periods : 20 (1 - 20)
#> Type : directed
#> Num of behaviors : 1
#> Final prevalence : 0.95
#> Static attributes : -
#> Dynamic attributes : -
summary(diffnet)
#> Diffusion network summary statistics
#> Name : Diffusion Network
#> Behavior : Unknown
#> -----------------------------------------------------------------------------
#> Period Adopters Cum Adopt. (%) Hazard Rate Density Moran's I (sd)
#> -------- ---------- ---------------- ------------- --------- ----------------
#> 1 8 8 (0.08) - 0.50 -0.01 (0.00)
#> 2 3 11 (0.11) 0.03 0.50 -0.01 (0.00)
#> 3 6 17 (0.17) 0.07 0.51 -0.01 (0.00)
#> 4 3 20 (0.20) 0.04 0.49 -0.01 (0.00)
#> 5 9 29 (0.29) 0.11 0.50 -0.01 (0.00)
#> 6 5 34 (0.34) 0.07 0.50 -0.01 (0.00)
#> 7 2 36 (0.36) 0.03 0.51 -0.01 (0.00)
#> 8 3 39 (0.39) 0.05 0.50 -0.01 (0.00)
#> 9 5 44 (0.44) 0.08 0.50 -0.01 (0.00)
#> 10 1 45 (0.45) 0.02 0.49 -0.01 (0.00)
#> 11 3 48 (0.48) 0.05 0.50 -0.01 (0.00)
#> 12 6 54 (0.54) 0.12 0.50 -0.01 (0.00)
#> 13 8 62 (0.62) 0.17 0.50 -0.01 (0.00)
#> 14 9 71 (0.71) 0.24 0.50 -0.01 (0.00)
#> 15 5 76 (0.76) 0.17 0.50 -0.00 (0.00) **
#> 16 7 83 (0.83) 0.29 0.50 -0.01 (0.00)
#> 17 5 88 (0.88) 0.29 0.49 -0.00 (0.00) ***
#> 18 4 92 (0.92) 0.33 0.50 -0.01 (0.00)
#> 19 1 93 (0.93) 0.12 0.50 -0.01 (0.00)
#> 20 2 95 (0.95) 0.29 0.50 -0.01 (0.00)
#> -----------------------------------------------------------------------------
#> Left censoring : 0.08 (8)
#> Right centoring : 0.05 (5)
#> # of nodes : 100
#>
#> Moran's I was computed on contemporaneous autocorrelation using 1/geodesic
#> values. Significane levels *** <= .01, ** <= .05, * <= .1.
# Visualizing distribution of suscep/infect
out <- plot_infectsuscep(diffnet, bins = 20,K=5, logscale = FALSE, h=.01)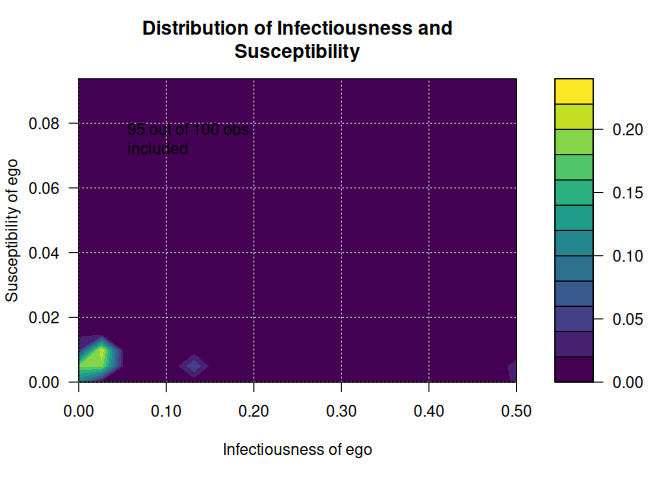
out <- plot_infectsuscep(diffnet, bins = 20,K=5, logscale = TRUE,
                         exclude.zeros = TRUE, h=1)
#> Warning in plot_infectsuscep.list(graph$graph, graph$toa, t0, normalize, : When
#> applying logscale some observations are missing.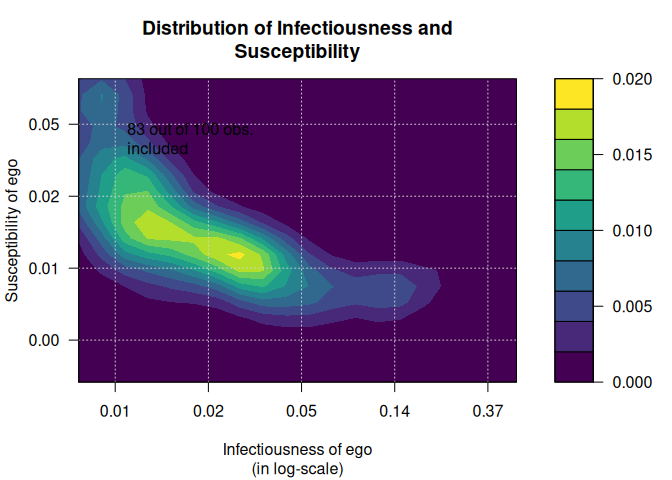
# Generating a random graph
set.seed(123)
diffnet <- rdiffnet(500, 20,
                    seed.nodes = "random",
                    rgraph.args = list(m=3),
                    threshold.dist = function(x) runif(1, .3, .7))
diffnet
#> Dynamic network of class -diffnet-
#>  Name               : A diffusion network
#>  Behavior           : Random contagion
#>  # of nodes         : 500 (1, 2, 3, 4, 5, 6, 7, 8, ...)
#>  # of time periods  : 20 (1 - 20)
#>  Type               : directed
#>  Num of behaviors   : 1
#>  Final prevalence   : 1.00
#>  Static attributes  : real_threshold (1)
#>  Dynamic attributes : -

# Threshold with fixed vertex size
plot_threshold(diffnet)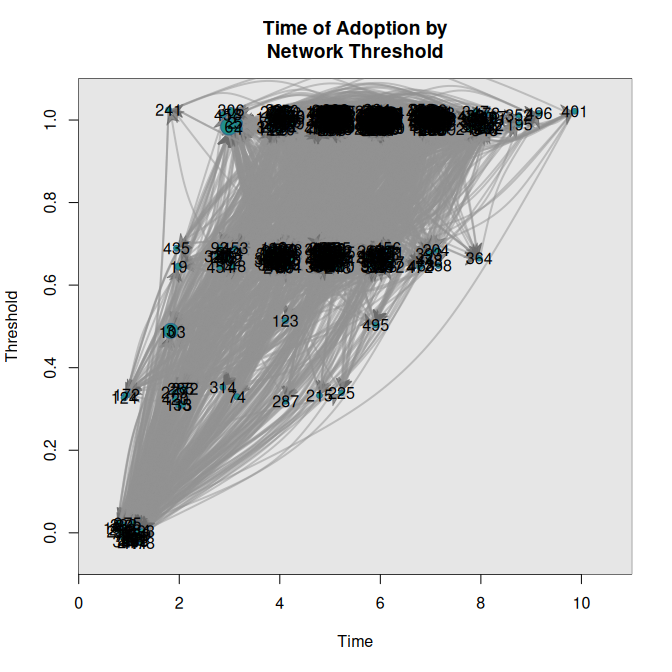
Using more features
data("medInnovationsDiffNet")
set.seed(131)
plot_threshold(
  medInnovationsDiffNet,
  vertex.color     = viridisLite::inferno(4)[medInnovationsDiffNet[["city"]]],
  vertex.sides     = medInnovationsDiffNet[["city"]] + 2,
  sub = "Note: Vertices' sizes and shapes given by degree and city respectively",
  jitter.factor = c(1,1), jitter.amount = c(.25,.025)
)
#> Warning in (function (graph, expo, toa, include_censored = FALSE, t0 = min(toa,
#> : -vertex.sides- will be coerced to integer.
plot_adopters(diffnet)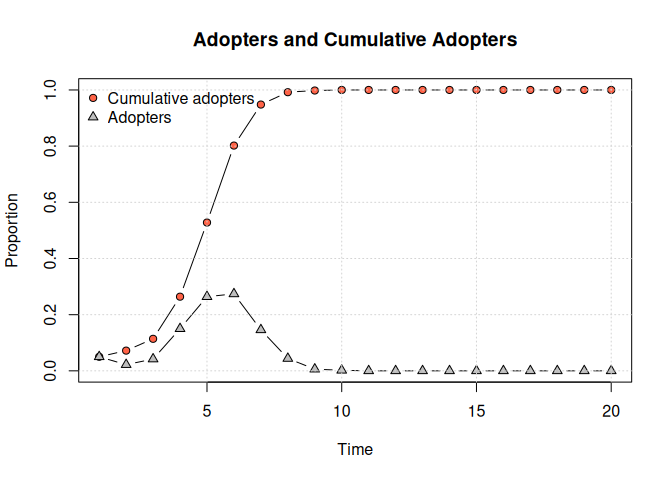
hazard_rate(diffnet)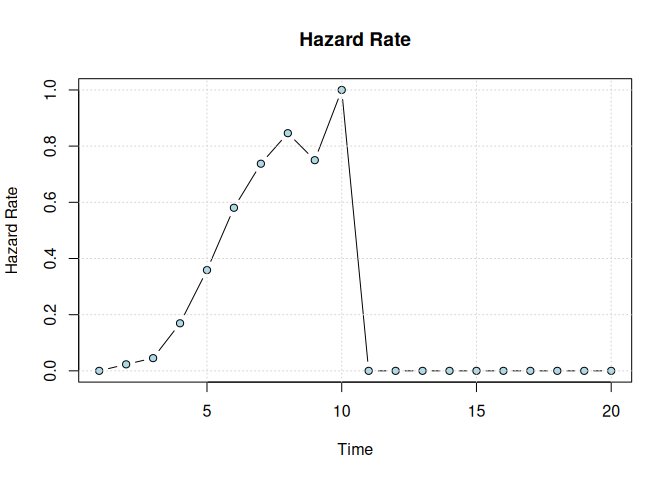
plot_diffnet(medInnovationsDiffNet, slices=c(1,9,8))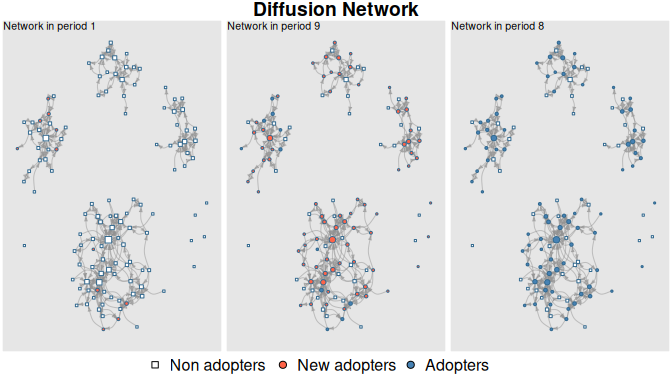
diffnet.toa(brfarmersDiffNet)[brfarmersDiffNet$toa >= 1965] <- NA
plot_diffnet2(brfarmersDiffNet, vertex.size = "indegree")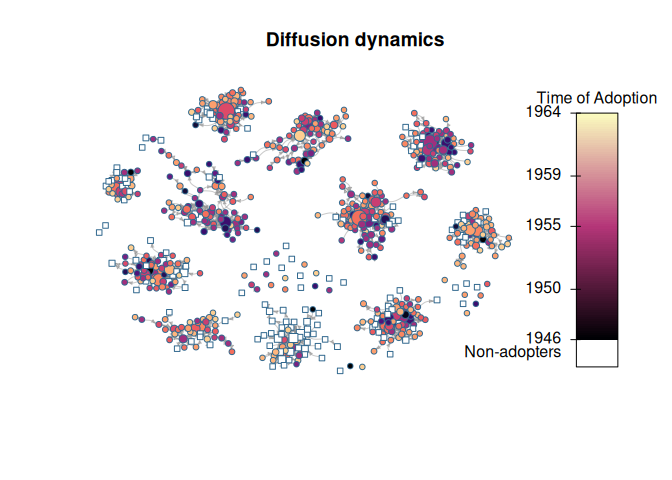
set.seed(1231)

# Random scale-free diffusion network
x <- rdiffnet(1000, 4, seed.graph="scale-free", seed.p.adopt = .025,
                           rewire = FALSE, seed.nodes = "central",
                           rgraph.arg=list(self=FALSE, m=4),
                           threshold.dist = function(id) runif(1,.2,.4))

# Diffusion map (no random toa)
dm0 <- diffusionMap(x, kde2d.args=list(n=150, h=1), layout=igraph::layout_with_fr)

# Random
diffnet.toa(x) <- sample(x$toa, size = nnodes(x))

# Diffusion map (random toa)
dm1 <- diffusionMap(x, layout = dm0$coords, kde2d.args=list(n=150, h=.5))

oldpar <- par(no.readonly = TRUE)
col <- viridisLite::plasma(100)
par(mfrow=c(1,2), oma=c(1,0,0,0), cex=.8)
image(dm0, col=col, main="Non-random Times of Adoption\nAdoption from the core.")
image(dm1, col=col, main="Random Times of Adoption")
par(mfrow=c(1,1))
mtext("Both networks have the same distribution on times of adoption", 1,
      outer = TRUE)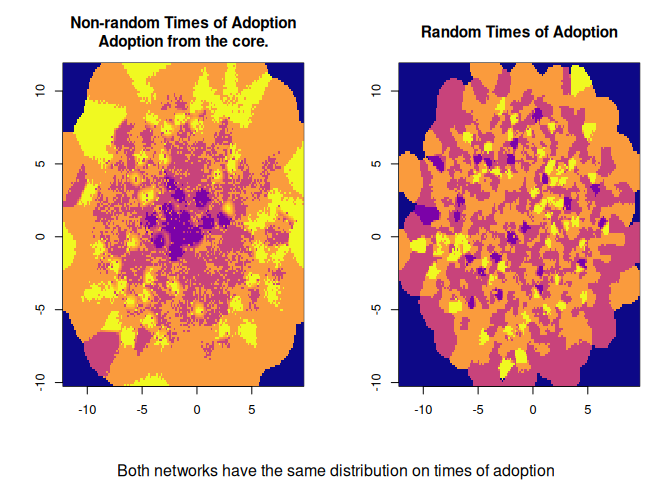
par(oldpar)out <- classify(kfamilyDiffNet, include_censored = TRUE)
ftable(out)
#> thr Non-Adopters Very Low Thresh. Low Thresh. High Thresh. Very High Thresh.
#> toa
#> Non-Adopters 0.00 0.00 0.00 0.00 0.00
#> Early Adopters 0.00 14.04 8.40 0.57 0.29
#> Early Majority 0.00 5.64 11.65 5.54 2.58
#> Late Majority 0.00 1.34 5.06 6.21 2.96
#> Laggards 0.00 1.53 0.00 0.00 34.19
# Plotting
oldpar <- par(no.readonly = TRUE)
par(xpd=TRUE)
plot(out, color=viridisLite::inferno(5), las = 2, xlab="Time of Adoption",
ylab="Threshold", main="")
# Adding key
legend("bottom", legend = levels(out$thr), fill=viridisLite::inferno(5), horiz = TRUE,
cex=.6, bty="n", inset=c(0,-.1))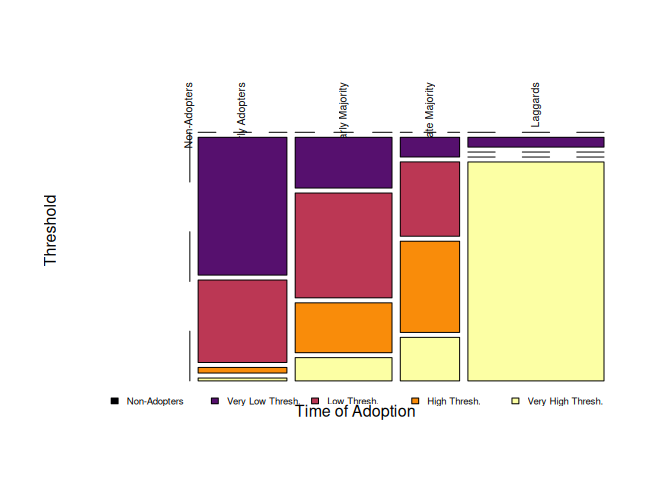
par(oldpar)sessionInfo()
#> R version 4.5.3 (2026-03-11)
#> Platform: aarch64-unknown-linux-gnu
#> Running under: Ubuntu 24.04.4 LTS
#>
#> Matrix products: default
#> BLAS: /usr/lib/aarch64-linux-gnu/openblas-pthread/libblas.so.3
#> LAPACK: /usr/lib/aarch64-linux-gnu/openblas-pthread/libopenblasp-r0.3.26.so; LAPACK version 3.12.0
#>
#> locale:
#> [1] LC_CTYPE=en_US.UTF-8 LC_NUMERIC=C
#> [3] LC_TIME=en_US.UTF-8 LC_COLLATE=en_US.UTF-8
#> [5] LC_MONETARY=en_US.UTF-8 LC_MESSAGES=en_US.UTF-8
#> [7] LC_PAPER=en_US.UTF-8 LC_NAME=C
#> [9] LC_ADDRESS=C LC_TELEPHONE=C
#> [11] LC_MEASUREMENT=en_US.UTF-8 LC_IDENTIFICATION=C
#>
#> time zone: Etc/UTC
#> tzcode source: system (glibc)
#>
#> attached base packages:
#> [1] stats graphics grDevices utils datasets methods base
#>
#> other attached packages:
#> [1] netdiffuseR_1.25.0
#>
#> loaded via a namespace (and not attached):
#> [1] Matrix_1.7-5 jsonlite_2.0.0 dplyr_1.2.0
#> [4] compiler_4.5.3 tidyselect_1.2.1 Rcpp_1.1.1
#> [7] networkLite_1.1.0 boot_1.3-32 yaml_2.3.12
#> [10] fastmap_1.2.0 lattice_0.22-9 coda_0.19-4.1
#> [13] R6_2.6.1 generics_0.1.4 MatchIt_4.7.2
#> [16] igraph_2.2.2 knitr_1.51 MASS_7.3-65
#> [19] backports_1.5.0 tibble_3.3.1 statnet.common_4.13.0
#> [22] pillar_1.11.1 rlang_1.1.7 xfun_0.56
#> [25] otel_0.2.0 viridisLite_0.4.3 cli_3.6.5
#> [28] magrittr_2.0.4 network_1.20.0 digest_0.6.39
#> [31] grid_4.5.3 lifecycle_1.0.5 vctrs_0.7.2
#> [34] SparseM_1.84-2 sna_2.8 evaluate_1.0.5
#> [37] glue_1.8.0 rmarkdown_2.31 tools_4.5.3
#> [40] pkgconfig_2.0.3 networkDynamic_0.11.5 htmltools_0.5.9statnet set (specially the packages
networkDynamic and ndtv),
igraphRsiena.select_egoalter would use
this)xspline for drawing polygons &
edges.exposure,
namely, self (so removes diagonal or not!).network for instance?).